Infant-mother interaction
This tutorial is based on an example extracted from the data analyzed in {cite:p}DobaEtAl22 article see [DoPN22]_.
Behavioral interaction between mother and her infant are video recorded while playing. Behaviors are encoded according to several categories. They are recorded during a first session before the mother leave temporally the room and after the mother comes back. The software used to encode the videos is called codix see [PDPN24]_
Read data
[1]:
import scyseq as sq
from scyseq import io
from scyseq import viz as V

data_S1 = io.read_codix("data/209_S1")
data_S2 = io.read_codix("data/209_S2")
The read_codix function returns a dictionary organized as data[person][code] which value is a symbolic Sequence coded according to a specific Alphabet:
[2]:
for person in data_S1.keys():
    print(person + ": ")
    for code in data_S1[person].keys():
        print("\t" + code + ": \t", data_S1[person][code].alphabet)
Bebe:
        Mouvement:       ((0 | Non), (1 | Oui))
        Expession_faciale:       ((0 | neutre), (1 | sourit), (2 | negatif))
        Regard:          ((0 | ailleurs), (1 | vers_la_mere))
        Sons:    ((0 | Silence), (1 | vocalisation), (2 | negatif))
Mere:
        Expression_faciale:      ((0 | Neutre), (1 | Expressif))
        Sti_motrices:    ((0 | Absence), (1 | Avec_contact), (2 | Sans_contact))
        Regard:          ((0 | Ailleurs), (1 | vers_bebe))
        Sti_verbale:     ((0 | Silence), (1 | Inference), (2 | Sons))
        Jeu:     ((0 | Absence), (1 | Avec_objet), (2 | Sans_objet))
In the study we discarded the facial expression code since the face of the mother and the infant could not be seen all the time.
[3]:
bmv1 = data_S1["Bebe"]["Mouvement"]
bcv1 = data_S1["Bebe"]["Sons"]
bre1 = data_S1["Bebe"]["Regard"]
bmv2 = data_S2["Bebe"]["Mouvement"]
bcv2 = data_S2["Bebe"]["Sons"]
bre2 = data_S2["Bebe"]["Regard"]

mmv1 = data_S1["Mere"]["Sti_motrices"]
mcv1 = data_S1["Mere"]["Sti_verbale"]
mre1 = data_S1["Mere"]["Regard"]
mmv2 = data_S2["Mere"]["Sti_motrices"]
mcv2 = data_S2["Mere"]["Sti_verbale"]
mre2 = data_S2["Mere"]["Regard"]

# rename motor behavior in English :-)
eng_mvt = {0: "NoMvt", 1: "Touch", 2: "NoTouch"}
mmv1.alphabet.rename(eng_mvt)
mmv2.alphabet.rename(eng_mvt)
Recode and transform sequences
The infant’s behavior was also recoded according to a general level of activity.
First, the three sequences (motor, verbal and gaze) are recoded according to the cartesian product of the alphabets:
[4]:
bbstate1 = sq.recode(
    [bmv1, bcv1, bre1], new_alphabet=True, names=["Mvt", "Verb", "Gaz"]
)
bbstate2 = sq.recode(
    [bmv2, bcv2, bre2], new_alphabet=True, names=["Mvt", "Verb", "Gaz"]
)
print(bbstate1.alphabet)  # some pretty print would be better...
((0 | Mvt_Non+Verb_Silence+Gaz_ailleurs), (1 | Mvt_Non+Verb_Silence+Gaz_vers_la_mere), (2 | Mvt_Non+Verb_vocalisation+Gaz_ailleurs), (3 | Mvt_Non+Verb_vocalisation+Gaz_vers_la_mere), (4 | Mvt_Non+Verb_negatif+Gaz_ailleurs), (5 | Mvt_Non+Verb_negatif+Gaz_vers_la_mere), (6 | Mvt_Oui+Verb_Silence+Gaz_ailleurs), (7 | Mvt_Oui+Verb_Silence+Gaz_vers_la_mere), (8 | Mvt_Oui+Verb_vocalisation+Gaz_ailleurs), (9 | Mvt_Oui+Verb_vocalisation+Gaz_vers_la_mere), (10 | Mvt_Oui+Verb_negatif+Gaz_ailleurs), (11 | Mvt_Oui+Verb_negatif+Gaz_vers_la_mere))
Then, states are transformed according to a correspondance table:
[5]:
naint = sq.Alphabet(["Low", "Moderate", "High"])
bbglo1 = sq.transform(
    bbstate1, [0, 0, 0, 1, 0, 1, 0, 1, 1, 2, 1, 2], new_alphabet=naint
)
bbglo2 = sq.transform(
    bbstate2, [0, 0, 0, 1, 0, 1, 0, 1, 1, 2, 1, 2], new_alphabet=naint
)
bbglo1
[5]:
Sequence: [0 0 1 1 0 1 0 2 1 0 0 0 1 1 0 1 1 1 1 0 2 1 1 1 1 1 1 0 1 1 0 0 0 0 0 1 1
 1 1 1 2 1 0 0 0 0 0 1 1 1 0 0 1 1 0 0 0 0 1 0 0 0 0 0 0 2 1 1 1 1 1 1 2 1
 1 1 1 1 0 0 1 1 1 1 2 1 2 1 1 1 0 0 1 1 2 0 0 0 2 1 2 2 2 2 2 2 2 0 0 1 0
 0 0 0 0 0 0 1 0 0 1 1 0 0 0 0 1 2 1 1 1 1 0 0 0 0 0 0 0 0 0 0 0 1 1 0 1 1
 2 0 0 1 0 1 0 0 0 0 0 0 1 1 1 1 1 0 0 0 0 0 0 0 0 0 0 0 1 1 1 2 1 2 2 1 2
 2 1 1 1 0 0 1 1 2 2 2 1 1 1 2 2 1 0 0 0 0 2 2 2 1 1 0 0 0 0 0 1 1 2 0 0 0
 0 0 0 0 0 0 0 0 0 0 0]
Alphabet(Symbol(0 | Low), Symbol(1 | Moderate), Symbol(2 | High))
N = 233 ; k = 3
Visualise sequences
One sequence
[6]:
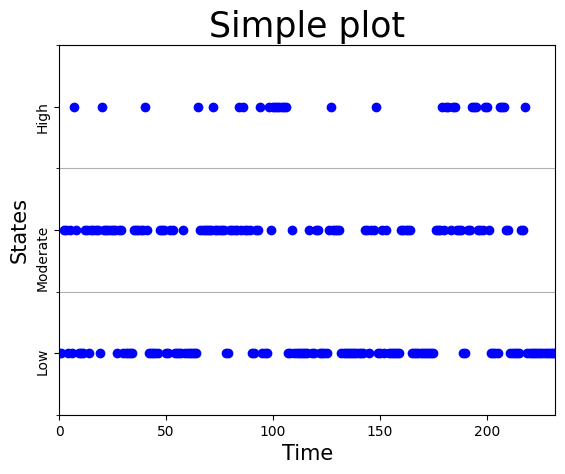
V.plot(bbglo1)
[7]:
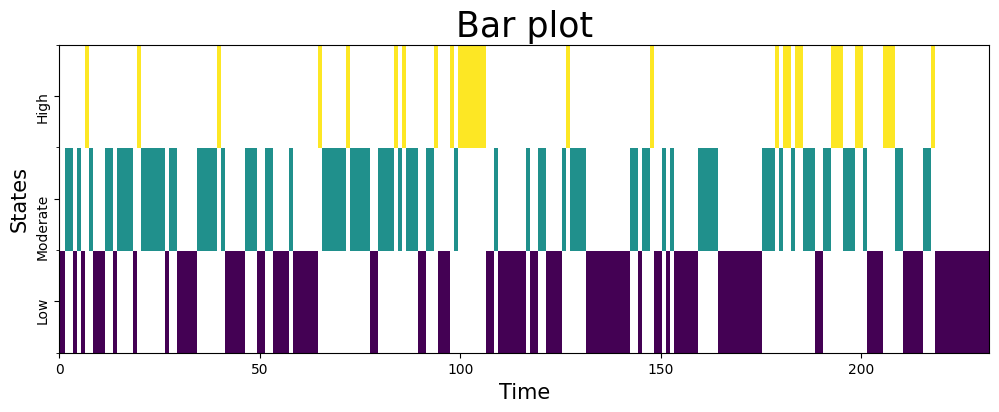
V.plot_bar(bbglo1)
[7]:
(<Figure size 1200x400 with 1 Axes>,
 <Axes: title={'center': 'Bar plot'}, xlabel='Time', ylabel='States'>)
[8]:
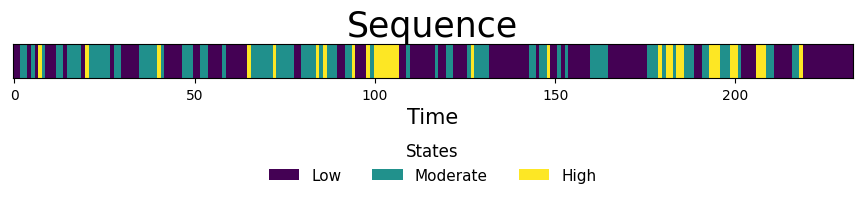
V.plot_color(bbglo1)
[8]:
(<Figure size 1000x240 with 1 Axes>,
 <Axes: title={'center': 'Sequence'}, xlabel='Time'>)
Two sequences
[9]:
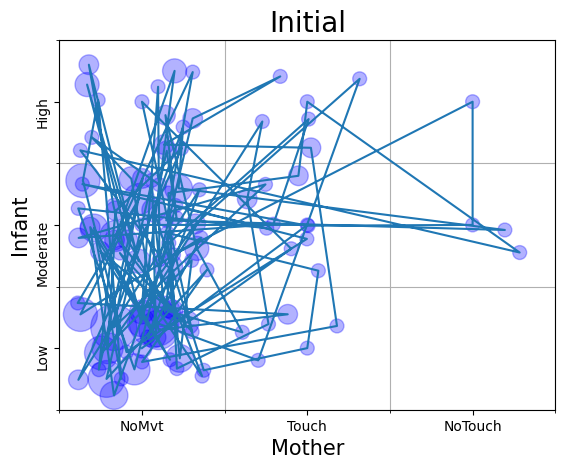
V.plot_grid(
    mmv1, bbglo1, xlabel="Mother", ylabel="Infant", title="Initial", titlesize=20
)
[9]:
(<Figure size 640x480 with 1 Axes>,
 <Axes: title={'center': 'Initial'}, xlabel='Mother', ylabel='Infant'>)
[10]:
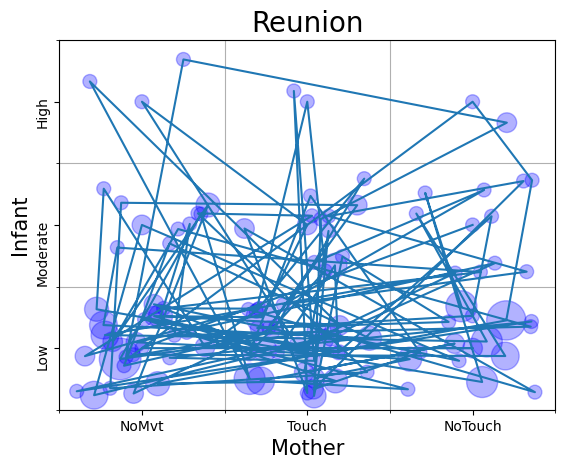
V.plot_grid(
    mmv2, bbglo2, xlabel="Mother", ylabel="Infant", title="Reunion", titlesize=20
)
[10]:
(<Figure size 640x480 with 1 Axes>,
 <Axes: title={'center': 'Reunion'}, xlabel='Mother', ylabel='Infant'>)
[11]:
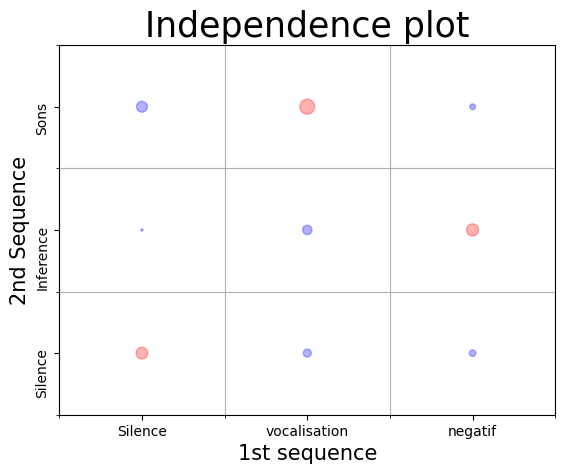
V.plot_independence(bcv1, mcv1, scale=2500)